Oh Beautiful Signals!
Unlike overwhelming data exploration tools, Dashgrid focuses on simplicity and user experience helping you and your data audience to track the signals and insights which matter, without the complexity.
Lightweight, beautiful signals,
and insights.
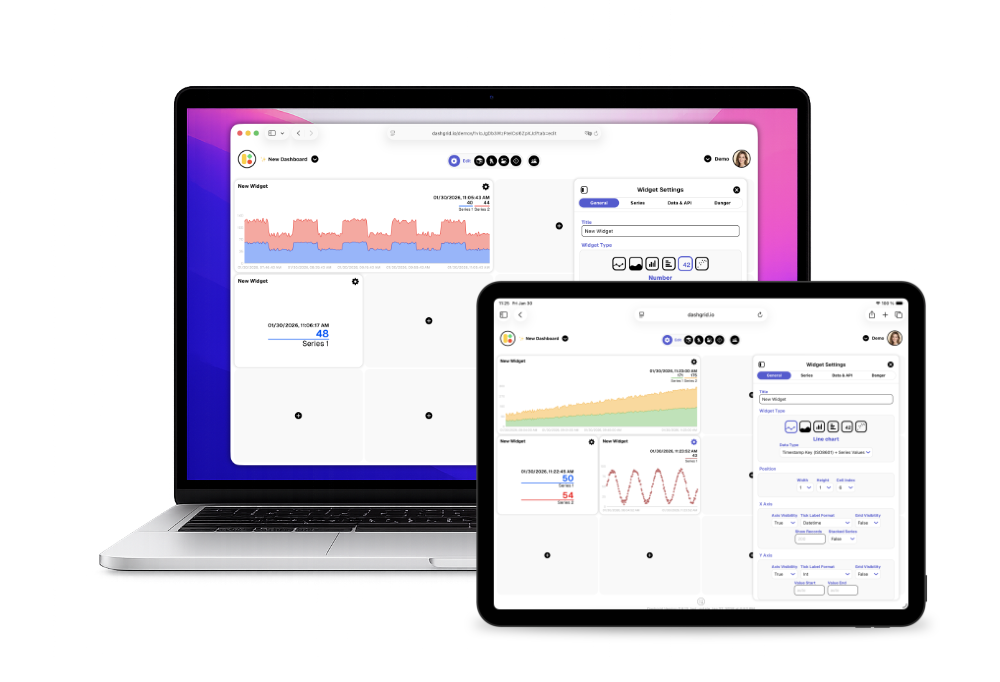
With Dashgrid you can create, run, combine, and share dashboards, widgets, data buckets, and more. So you can focus and track the signals which matter to you and your stakeholders.
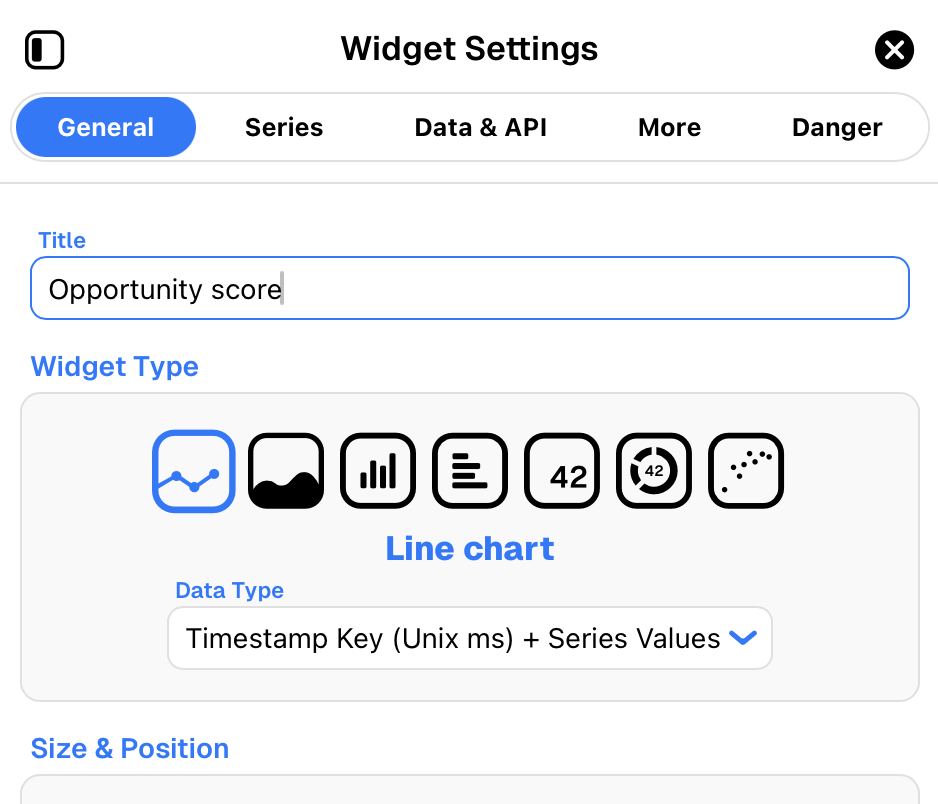
A widget system crafted for beauty,
and consistency.
Dashgrid's unique widget system is designed specifically to allow dashboard users to focus on signals which truly matter. Fundamentally responsive, robust and yet flexible.
Share Without Barriers
Deliver signals and insights to any audience, automatically, on scale, in realtime.
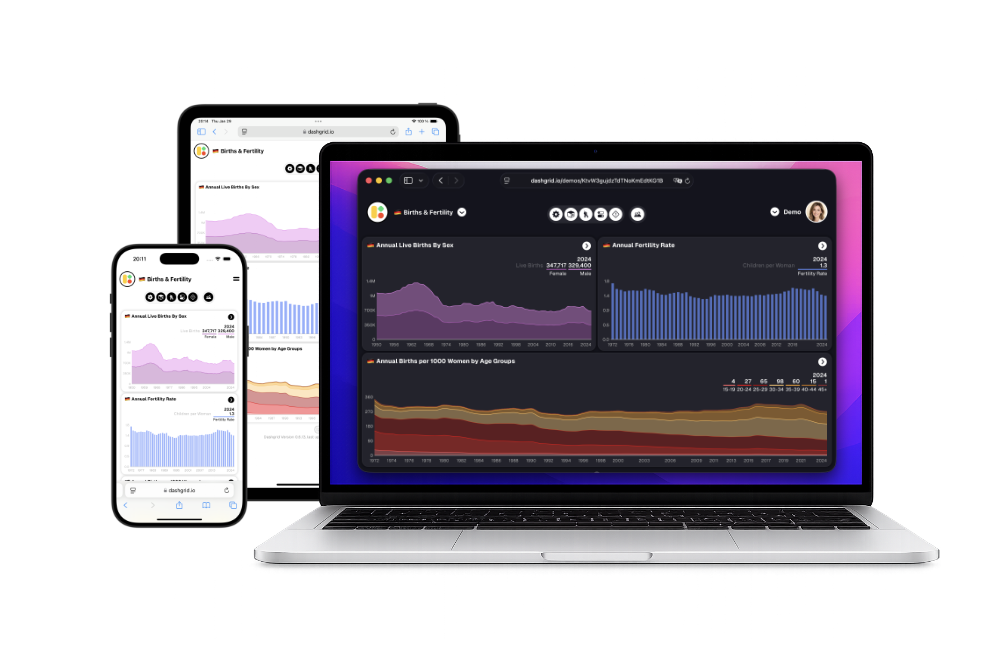
Private, team, or public.
Your signals, your reach.
Make your signals and insights reach the minds which matter. Share just with your colleagues, or entire teams. If your goal is to reach the world, go public (coming soon).
Deliver automatically.
In realtime.
Whenever you update your data, your signals and insights are delivered in realtime to your audience. Effective data flow management allows flexible traffic and cost control.
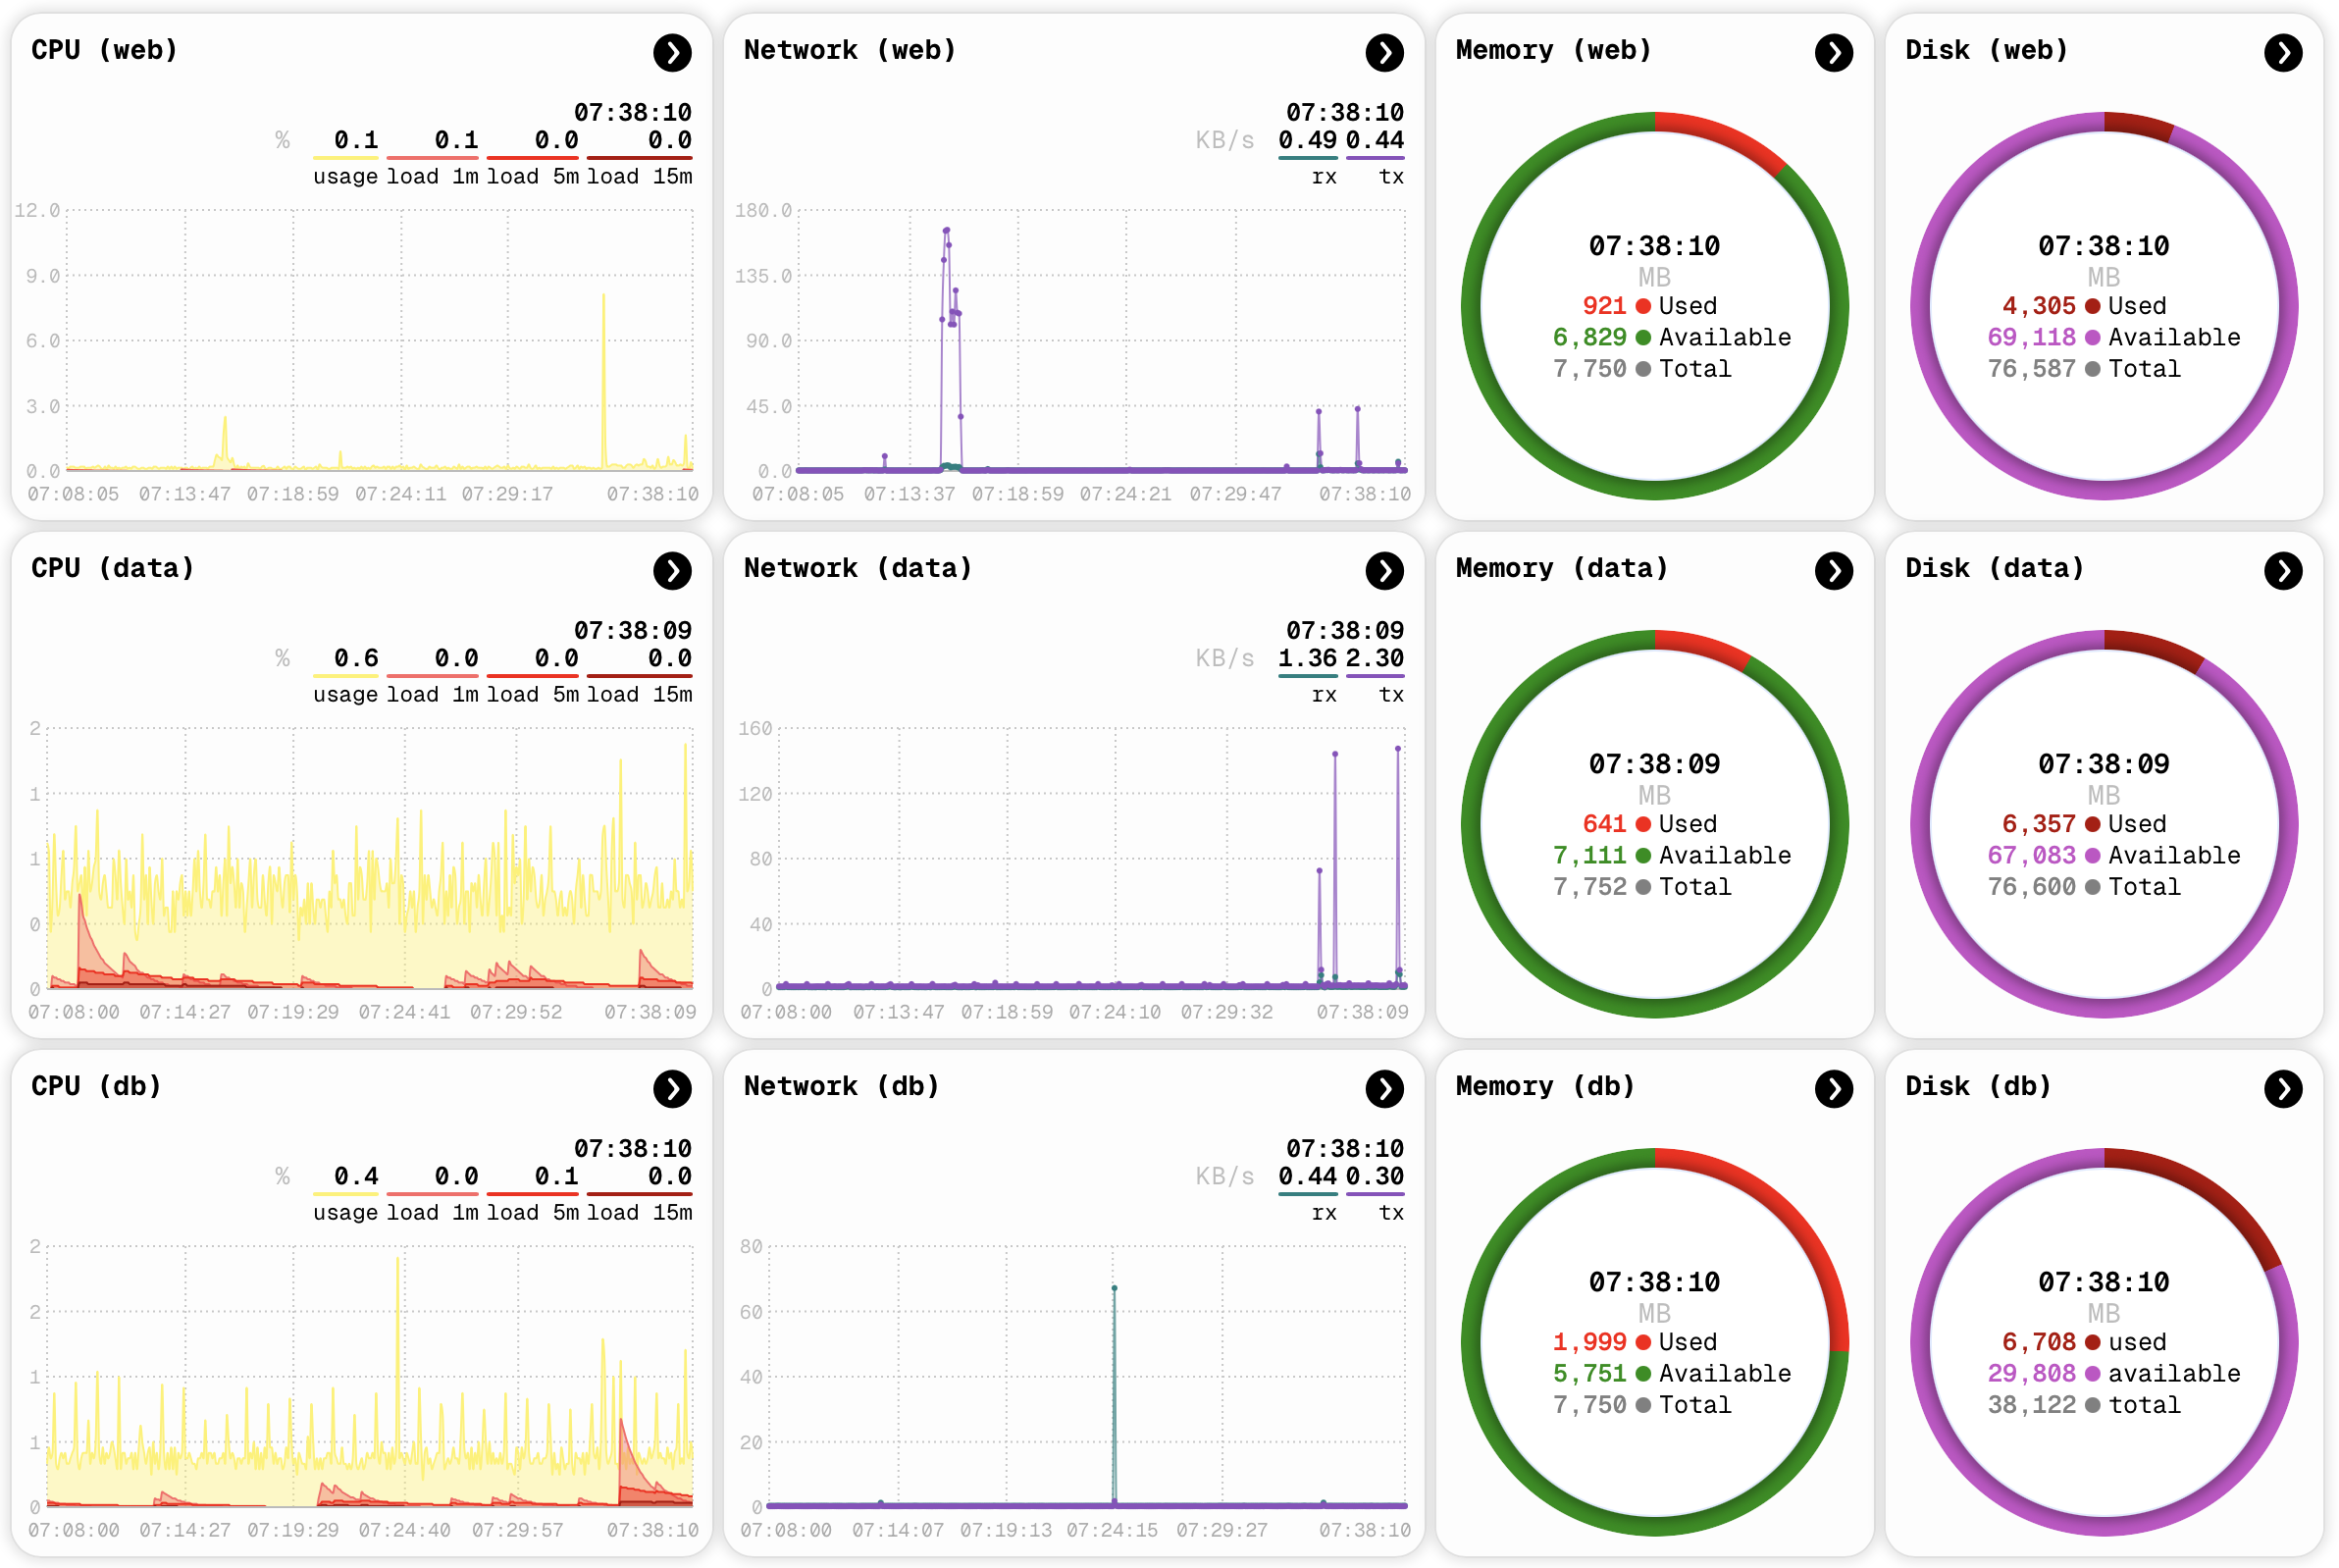
Slim Data Integration
Integrates with any code, blends with every infrastructure.
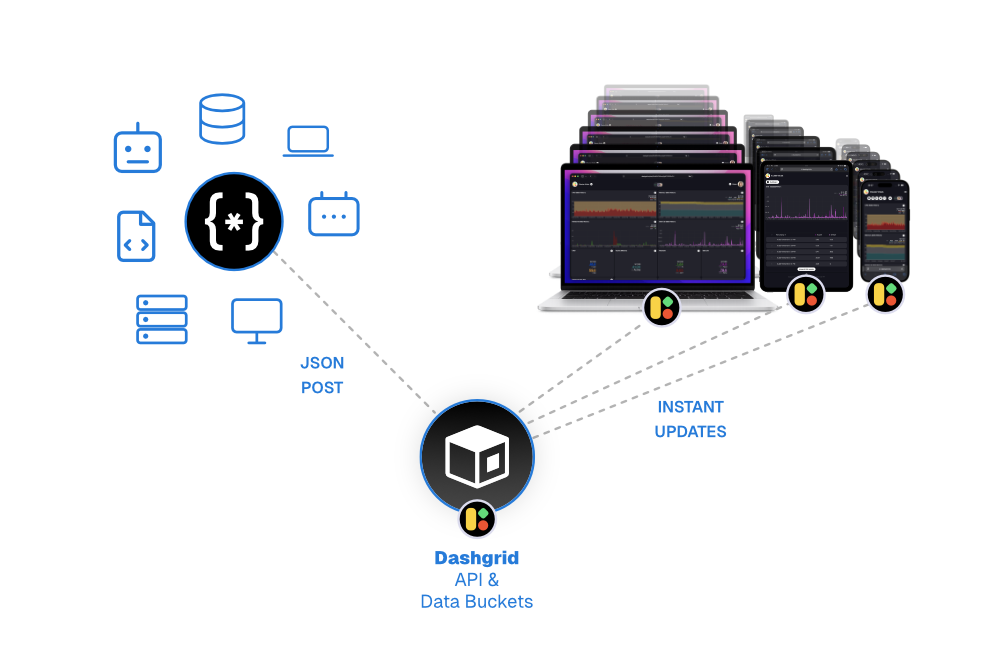
No data silos.
Just Data Buckets.
Dashgrid's Data Buckets are engineered to store and deliver your data to your dashboards consistently, fast, and without friction. Access controls and data retention built-in.
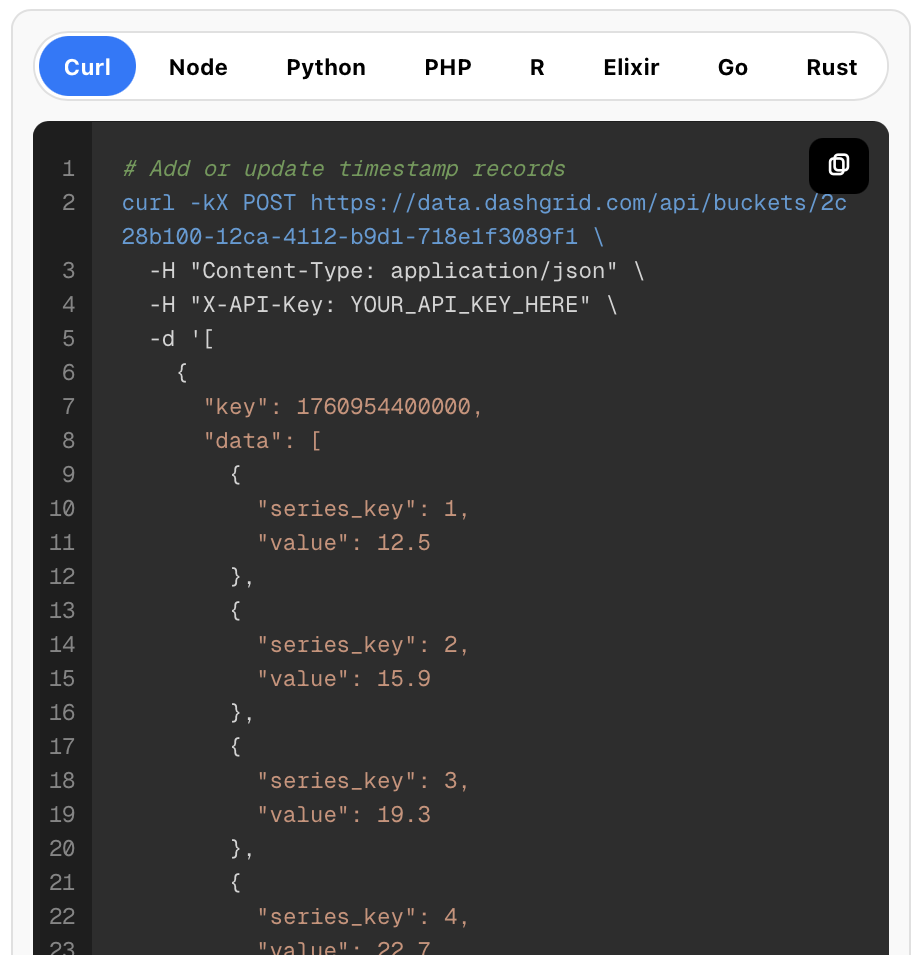
Blazing fast APIs.
Laser-focused integrations.
Push, create, update, delete data directly from your code via API to Dashgrid Data Buckets — minimal integration, minimal complexity, high or low frequency. Endless possibilities.