Tutorial Birth & Fertility Rates Dashboard
1. What we build
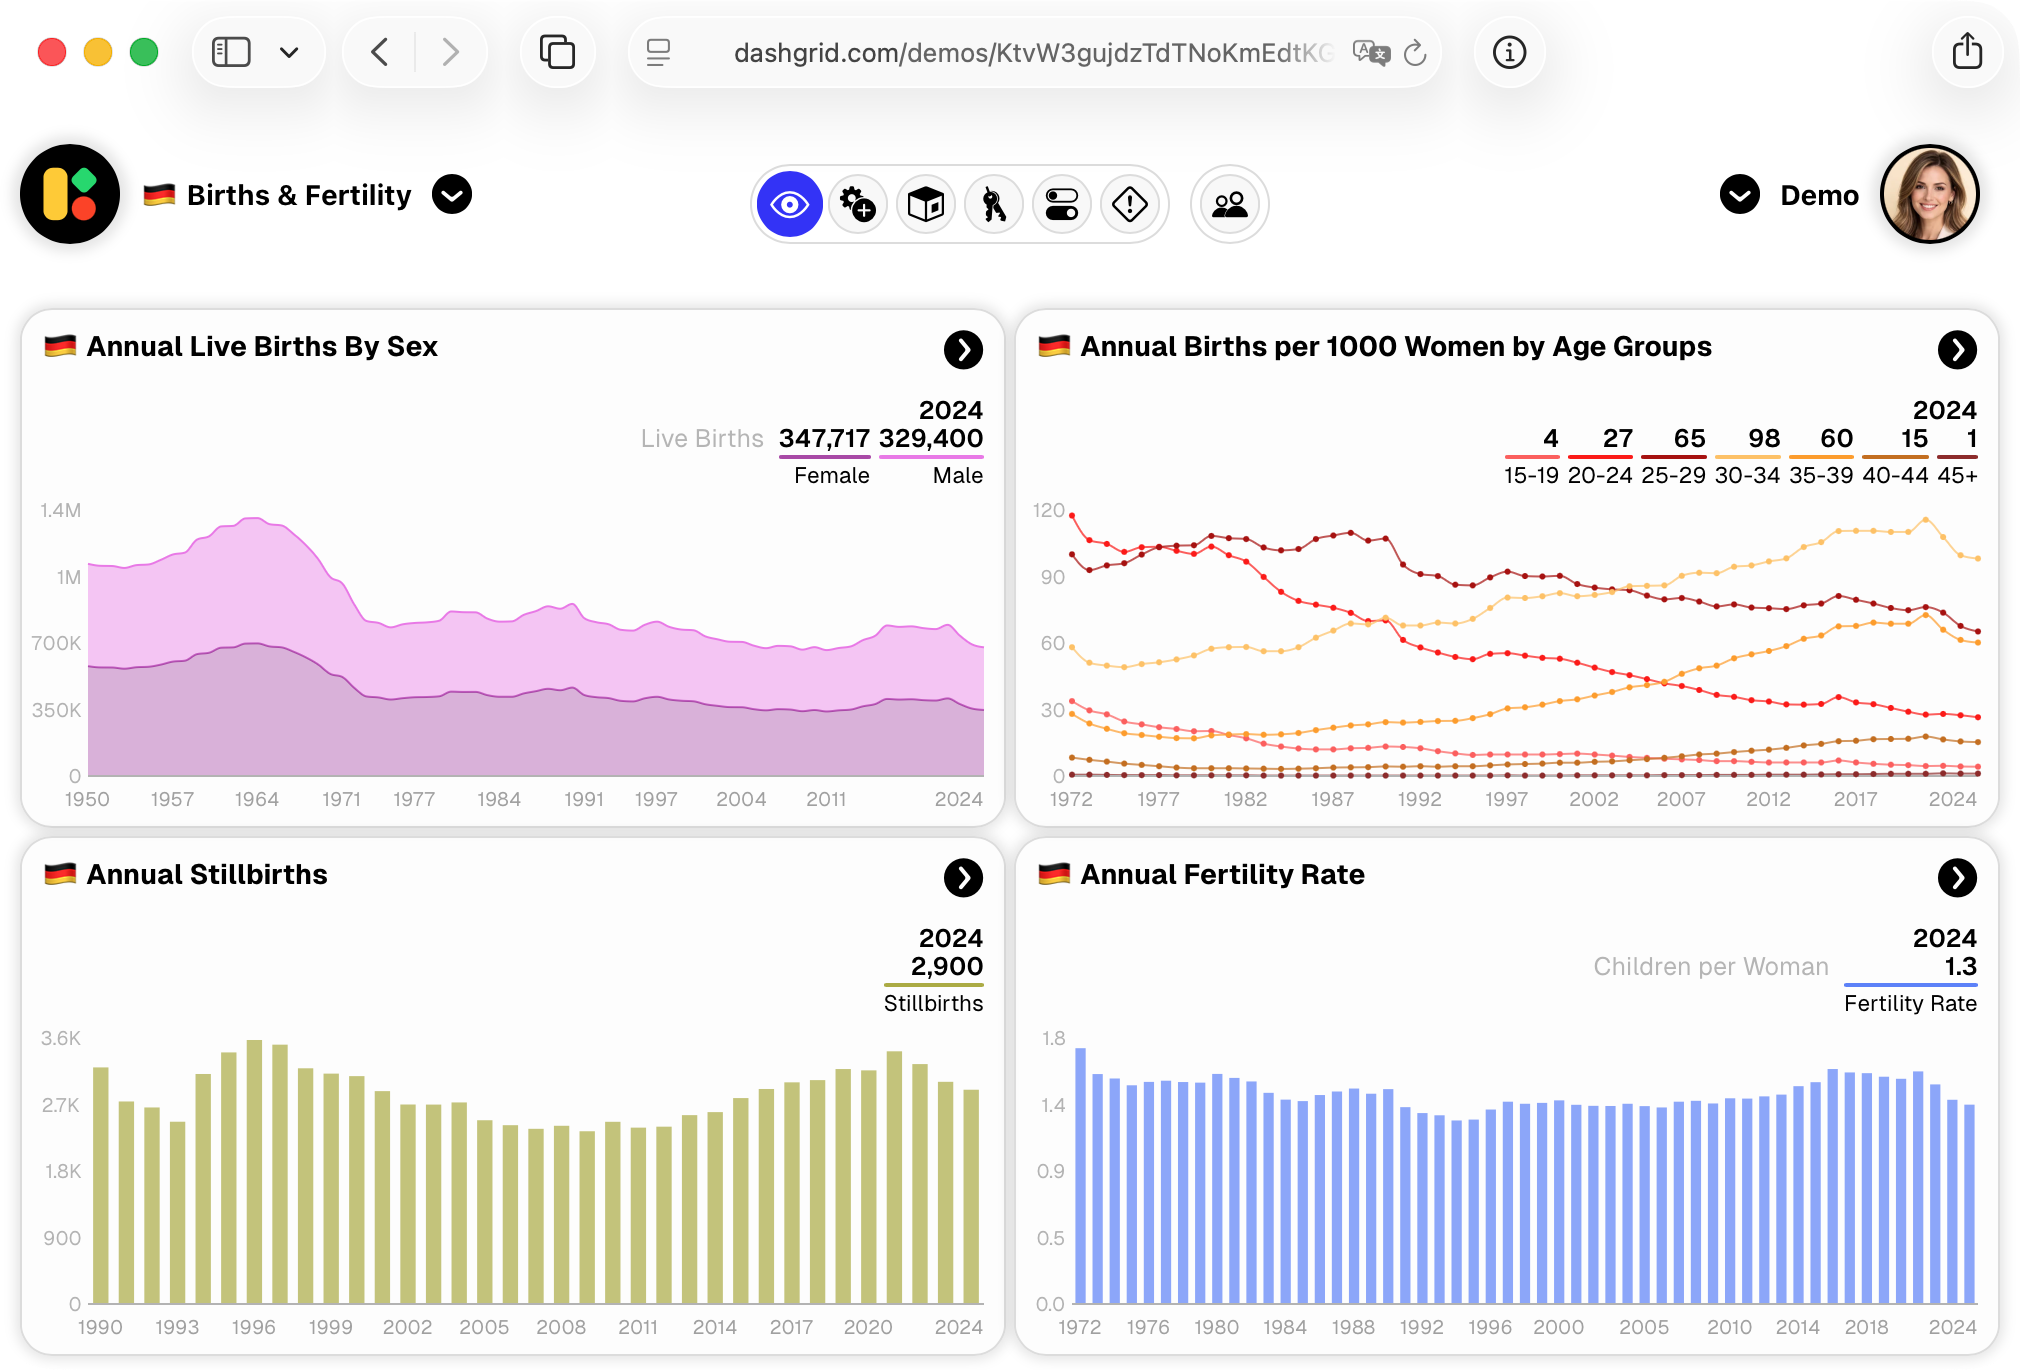
In this tutorial we will create a dashboard tracking German birth statistics using Dashgrid. The data is taken from DESTATIS-GENESIS (Statistisches Bundesamt).
www-genesis.destatis.de. All data is included in our tutorial repository.
The dashboard will present the following charts
- Chart 1: Annual Live Births By Sex in Germany.
- Chart 2: Annual Live Births Per 1000 Women in Age Groups in Germany.
- Chart 3: Annual Stillbirths in Germany.
- Chart 4: Annual Fertility Rate per Woman in Germany.
In the next steps we will
- Create the dashboard and widgets.
- Create an API key to be able to submit data to Dashgrid.
- Create Data Buckets, which will hold the data for each widget/chart.
- Submit the data test the dashboard.
2. Prerequisites
- Active user account on dashgrid.com
- Python knowledge
- Python 3.10+ installed on your computer
- uv package manager
Setup
- Clone or download this repository
git clone git@github.com:dashgrid-dev/tutorial-birth-rates.git
Repo URL: https://github.com/dashgrid-dev/tutorial-birth-rates
- Install dependencies
cd tutorial-birth-rates
uv sync
Configuration
The configuration parameters of the Python script are in
src/config.py:
We will fill these vars step by step by creating the
necessary ressources in Dashgrid and filling in the required values.
API_KEY = "dk_your_api_key_here"
BUCKET_1_ID = None  # Annual Live Births By Sex
BUCKET_2_ID = None  # Births per 1000 Women
BUCKET_3_ID = None  # Stillbirths
BUCKET_4_ID = None  # Fertility Rate
Code
The code provides simple working examples how submit data to a Dashgrid dashboard.
Specifically to the dashboard we are build in this tutorial.
3. Create dashboard
- Create a new dashboard with the title "🇩🇪 Births & Fertility".
- Set the Grid Layout to 2 columns and 2 rows, so the dashboard has cells for up to 4 widgets.
- Set Style to Default LF and save the new dashboard.
- You'll be redirected to the new dashboard, showing empty cells.
Let's create the first widget and chart (Chart 1):
- Click the + (plus) button in the left top cell of the dashboard to create a new widget for the first chart.
- Give it the title "🇩🇪 Annual Live Births By Sex"
- Choose the Widget Type "Area Chart". The chart will show random placeholder data.
- Select Data Type "String Key + Series Values".
- In the X Axis section set "Stacked Series" to True.
Now let's configure the chart series:
- Switch to the "Series" Tab and create a total of 2 series.
- Series label: "Female", pick a color.
- Series label: "Male", pick a color.
- In General tab, section Tooltip type "Live Births" into the Unit field
- Close the Widget Settings window.
Now let's submit the data for this widget.
5. Create a Data Bucket
In Dashgrid data is stored and managed in Data Buckets. A Data Bucket is a fast and efficient data storage which can be connected to multiple widgets.
You are already in the widget settings from the previous step. While staying there, create and connect the first bucket. For this tutorial we will use a distinct data bucket for each widget, because we have 4 different charts, all with different data.
- In the Data & API tab, find Quick Create Data Bucket.
- Enter the name "data_germany_annual_live_births_by_sex".
- Click "Create & Connect" (the bucket type is automatically set to "String Key ...").
- A Selected Bucket area appears with a Bucket ID. Copy it and head over to your IDE and open
./config.py
Set BUCKET_1_ID with your bucket id:
BUCKET_1_ID = "e.g. 1844d2e8-957f-4ca7-870b....."
6. Create API key
In the API Key tab of the dashboard
- Create a key and copy it
- Place the API key in the
./config.py
# API key, str
API_KEY = "e.g. dk-62ce11c4-c5e040c15d......"
With this key our Python script will be able to write into any Data Bucket of this dashboard.
7. Submit data
Let's now submit the data for the first widget:
- Make sure you are in the right directory to run the Python script
- Execute to submit data:
uv run python src/main.py
The data should appear instantly in the widget "🇩🇪 Annual Live Births By Sex".
You should see now that the Y axis has numbers in the millions, which takes a lot of
space. We can optimize that.
- In the the widget's settings (Y Axis section) set "Tick Label Format" to "Int (K,B.M)". This is a shortened format for large integer numbers.
- Title: "🇩🇪 Annual Births per 1000 Women by Age Groups"
- Widget Type: "Area Chart"
- Data Type: "String Key..."
- Series keys & labels:
- 15-19
- 20-24
- 25-29
- 30-34
- 35-39
- 40-44
- 45+"
- Set "Stacked Series" to True
- In the Data & API tab, use Quick Create Data Bucket with the name "data_germany_annual_birth_per_1000_by_age" (it will auto-connect and use "String Key...")
- Place the bucket id in the
config.py file
BUCKET_2_ID = "..."
- Title: "🇩🇪 Annual Stillbirths"
- Widget Type: "Column Chart"
- Data Type: "String Key..."
- Series keys and labels:
- Stillbirths
- In the Data & API tab, use Quick Create Data Bucket with the name "data_germany_annual_stillbirths" (auto-connects with "String Key...")
- Place the bucket id in the
config.py file BUCKET_3_ID = "....."
BUCKET_3_ID = "..."
- Title: "🇩🇪 Annual Fertility Rate"
- Widget Type: "Line Chart"
- Data Type: "String Key..."
- Series keys & labels:
- Fertility Rate
- Set the Y Axis Tick Label Format to Decimal (K,M,B)
- Set the Tooltip Value Format to Decimal (K,M,B)
- In the Data & API tab, use Quick Create Data Bucket with the name "data_germany_annual_fertility_rate" (auto-connects with "String Key...")
- Place the bucket id in the
config.py file
BUCKET_4_ID = "..."
9. Submit Data
Make sure all the IDs are set in the config.py
API_KEY = "dk_your_api_key_here"
BUCKET_1_ID = "Your bucket id 1"      # Annual Live Births By Sex
BUCKET_2_ID = "Your bucket id 2"      # Births per 1000 Women
BUCKET_3_ID = "Your bucket id 3"      # Stillbirths
BUCKET_4_ID = "Your bucket id 4"      # Fertility Rate
Then run...
uv run python src/main.py
...all widgets in your dashboard should now getting filled with data instantly!
🎉 Congratulations! Your first Dashgrid
dashboard is ready to use and to share.
10. Share your dashboard
You can now share your new dashboard e.g. with colleagues
so everyone has access to a responsive, up-to-date dashboard.
Read more about Sharing